I've added post towns to postcode districts. The data isn't perfect since postcode districts may have multiple post towns and I'm unable to get the data at the individual postcode level as it's not freely available. If you do need the post town for individual postcodes, you'll need to purchase the PAF dataset from one of the Royal Mail's resellers
Blog
Wednesday, May 3, 2023
I've uploaded the latest house price data from the Land Registry to the website. Prices continue their upward march, seemingly unaffected by interest rate rises. Sales volumes appear pretty low, although that's possibly due to the laggy nature of the Land Registry data
Tagged:
House prices
Wednesday, April 19, 2023
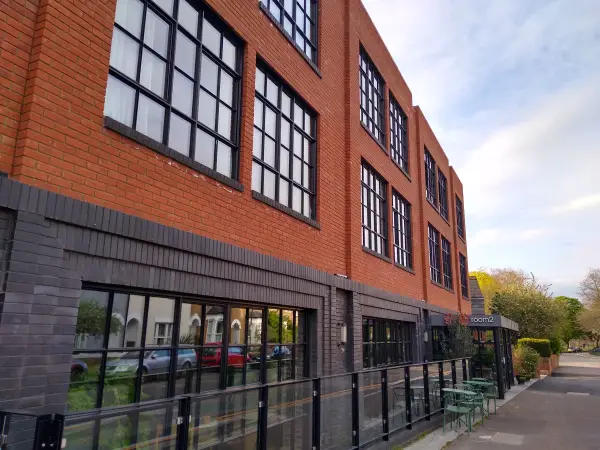
12 months ago my brother Andy stayed here in room2 in Chiswick. I visited the other day to see what it was like. It looks like a modern, well equipped hotel with a small park round the corner, fairly close to the centre of Chiswick. Andy was here to renew his passport, since he couldn't do it through the post because he didn't have an address in the UK.
I live less than 10 miles away but Andy didn't tell me he was visiting. In fact I met up with my other brother Simon down the road in Battersea whilst Andy was here. Maybe if we'd seen him then, we may have realised he needed some help. It might have helped him just to see his family since we hadn't seen him in person since before the pandemic had started.
He'd been in various foreign countries, locked down initially like the rest of us, then moving around to countries with the fewest Covid restrictions. He was into conspiracy theories about Covid, the vaccines and the Great Reset. I hadn't talked to him for months because all he wanted to talk about was his latest theories on the tyranny that was being inflicted on us and would continue to be inflicted on us.
Andy was no fool. Of the four brothers, he was the cleverest and most successful professionally. He studied at St Andrews and Cambridge, worked for IBM, Microsoft and Sony. He did so well out of his Microsoft share options that he'd been retired for several years. I think he was first drawn into conspiracy theories with 9/11. Something was suspicious about the way the buildings collapsed, Building 7 shouldn't have collapsed at all. We discussed it and we agreed to disagree.
I always thought the 9/11 stuff was harmless fun. But if you think about the number of people who would have to be involved in the conspiracy then someone who is prepared to believe in it is much more likely to be sucked into other convoluted conspiracies. I now think all conspiracy theories are harmful and we should confront all of them (even the flat earthers and faked moon landing afficionados). Admittedly I'm not entirely clear how to fight against them, but I'm fairly sure it's better to start early before people have fallen too far into the rabbit hole.
Andy was more certain about his theories around Covid. His initial argument was that Covid was no worse than the flu so should be treated in the same way we deal with the flu. This had been my initial thought when I first heard of this new disease so I could sympathise with it. And in fact, that is pretty much how we are dealing with Covid now, with booster shots for vulnerable people and the rest of the population living with it.
But we didn't deal with it in this way initially because Covid was a very different proposition when no-one had any immunity to it. Letting it rip would mean huge numbers of people getting infected at the same time and quite a few ending up in hospitals that would quickly be unable to cope. People would die from Covid and other diseases purely because hospitals would be unable to treat them in time. That was considered an unacceptable outcome.
I think that if you never move beyond thinking this disease is just like the flu, then all of the other stuff naturally follows. The governments of the world must be choosing to treat this disease as a serious threat for some nefarious purpose. So it's the Great Reset or we are all being forced to take the vaccine to kill us. And as time progresses and none of these things happen, we get into even more ridiculous theories about some minor traffic management plans leading to 15 minute cities where we'll never be able to go anywhere more than 15 minutes away from our homes.
Andy's trip to Chiswick was the last time he was in the UK. He flew out to Budapest then moved onto Subotica in Serbia. He got a letter from HMRC asking about unpaid tax on share dividends. Although he'd been out of the country for most of the last few years, he was liable for some tax in a few years. We will never know for sure but my theory is a head full of conspiracies and two years of relative isolation had led to a fragile mental state and the HMRC letter pushed him over the edge. He killed himself on 19th June 2022.
Thursday, April 6, 2023
In my never ending quest to find ways to motivate myself to get out on my bike, I've tried lots of things. I started with trying to grab KOMs on Strava segments, but soon realised that I wasn't enough of a sprinter, climber or descender to have much success at that activity.
So next I moved onto visiting tiles in Veloviewer. The OS Grid divides the UK up into numbered squares of varying sizes, depending on the precision required. Based on the 1.5km square extended all round the world, Veloviewer challenges us to visit as many of them as possible. This has the advantage of not requiring any speed but the downside is that fairly quickly you need to be riding long distances to reach a square you've not visited before.
The next step was to attempt to ride every road, which is where Wandrer comes in. Ride a new road, get some points and climb up the leaderboard for your local area. This was lots of fun even when spending a large amount of time riding up and down dead ends and cul de sacs.
But back to those squares. What about if we split each 1.5km square into 64 tiny squares? And then tried to visit as many of those as possible? And what about if we tried to join all of them together, but only counting squares that are touched by other visited squares on all sides? That would be quite bonkers, right? That was my initial thought as well, but Squadrats still piqued my interest.
As the pandemic wound down I realised I'd soon have to start going into the office occasionally, joining Kingston to Guildford via Squadratinhos seemed like an interesting, if pointless, challenge.
My initial attempt was down the Portsmouth Road through Esher. After some off road fun round Esher Common I made it to Cobham, but then I was thwarted by what I came to realise was the biggest challenge in this new game, agricultural land. Urban squadratting is generally fairly straightforward since most squares are accessible by road, but rural areas have large areas of farm land, golf courses and reservoirs.
My next plan was to go via Epsom, Ashtead and Leatherhead and then follow the A246 to Guildford. This went well until I hit Effingham and couldn't figure out how to get any further.
So then I thought I would try going via Walton, Weybridge, Byfleet and Woking. I'd ignored this approach at first because there was no direct route to Walton. A bunch of reservoirs and nature reserves meant I had to go North to Feltham, then turn South through Sunbury to reach Walton.
Getting to Weybridge was easy enough but linking to Byfleet was blocked by the oligarch estate at St Georges Hill. I managed to blag my way in there by claiming I was meeting someone at the golf club and then continued on my way. Byfleet to Woking was simple but then I hit the Guildford green belt. I couldn't figure out a way past Sutton Green. For a while, I went East to see if I could find a route that way, I even considered riding up the A3 before I regained my senses.
I looked again at Sutton Green and realised a farmer's driveway was the key to getting past it. One misty morning, I gave it a go. His gate looked to be electronically controlled but there was enough play in it for me to fit my bike through the gap. I rode halfway up and turned round. A little bit more off roading and I was in the outskirts of Guildford.
I wasn't the first person to Squadrat to Guildford, although I think I was the first using that particular route. But Squadratting has made commuting much more interesting and I've visited places I didn't even know existed, even though I've commuted back and forth for several years. The squares initially seem far too small, but it means you can keep going in your local area for a long time before you run out of squares to visit.
Tagged:
Cycling
Tuesday, March 28, 2023
I've uploaded the latest property data to the website. Sales activity is still on the low side and although annual price inflation is still moving upwards, prices look to be drifting downwards.
Tagged:
House prices
Saturday, March 18, 2023
The blog now comes with an RSS feed, click on the link on the right. More excitement to follow...
Tagged:
Blog
Friday, March 17, 2023
I've been meaning to move my blog to this domain for a very long time. I've looked at various blog engines and always had trouble integrating them with what I've already built here. So I finally bit the bullet and built my own "blog engine", in quotes because all it currently consists of is a couple of pages and a database table. I've got lots of things to add it to but all future posts will be here.
Tagged:
Blog
- << First
- < Previous
- Page 5 of 5 (47 posts)